
I have now written some version of the same review comment on four or five manuscripts. It always arrives politely, somewhere around point two, and it is always the same question. What is the denominator?
Linked administrative data is seductive because the numerator comes free. Every admission, every procedure, every prescription, already counted, already coded, sitting there waiting for you. You can have a numerator in an afternoon. The denominator takes actual thought, and because it takes thought, it is the thing people skip.
Take joint replacement. Say you find that hip and knee replacements rose by half over a decade, and that women receive more of them than men. Two findings, both true as counts, and neither of them means anything yet.
The population grew and it aged. Standardise for that and a good part of the rise disappears. Most people get this far. The harder question is the second finding, and it is where I see careful analysts come unstuck. If you want to say something about access, the denominator is not the Australian population. It is the population with symptomatic end stage osteoarthritis of that joint. Osteoarthritis is more common in women. So a count that looks like women getting more surgery can, against the right denominator, turn into women getting less. The number does not just become more precise. It changes direction.
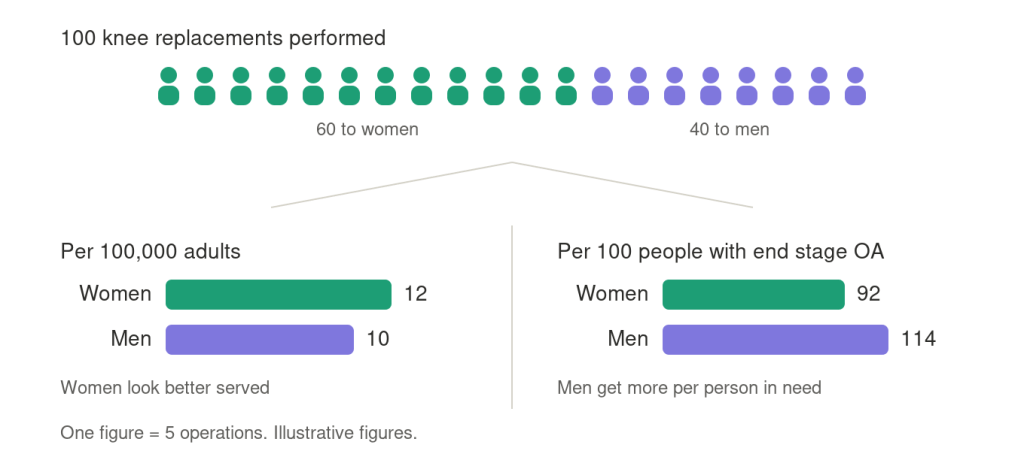
That is the part worth sitting with. A denominator is not a tidying step at the end of the analysis. It is the analysis. Choosing between “per 100,000 Australians” and “per 100,000 people with the condition” is choosing between two different research questions, and only one of them is the question about equity.
Two other things I keep flagging.
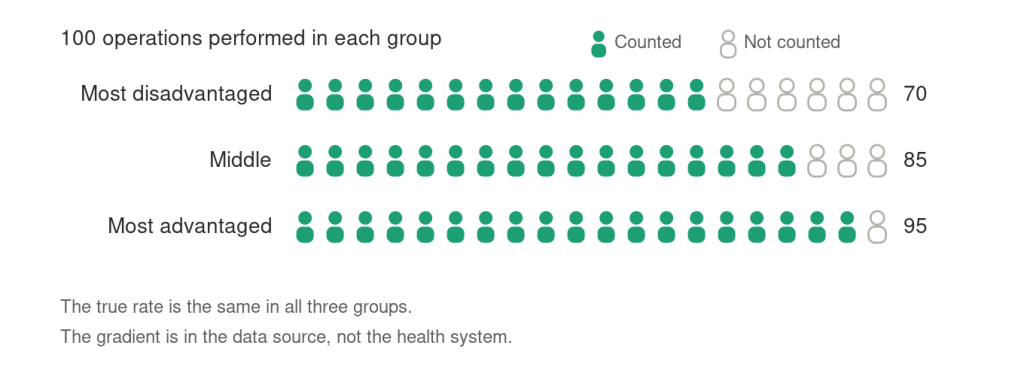
The denominator has to be ascertained the same way the numerator is. Joint replacement in Australia is split across the public and private sectors, and that split tracks income and postcode closely. Use a source that captures one sector completely and the other patchily, divide by the whole resident population, and you will produce a beautiful socioeconomic gradient that is mostly an artefact of where your data came from. If the operations you miss are concentrated in disadvantaged areas, the artefact points in exactly the direction everybody already expects, which is what makes it dangerous.
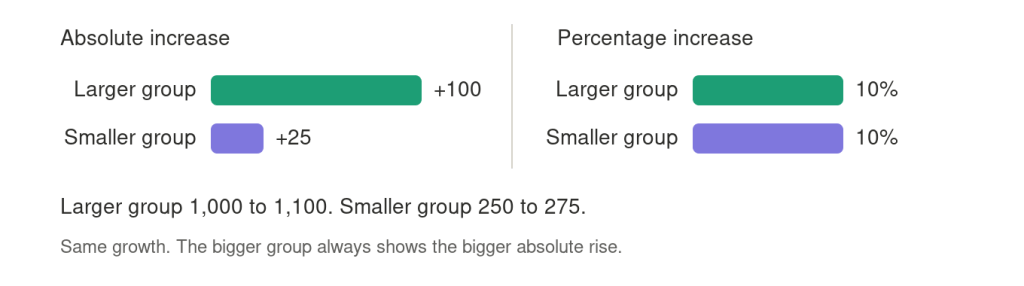
And growth belongs on the relative scale. If one group has four times the baseline volume of another and both grow by ten per cent, the larger group’s absolute increase will be four times bigger. Reporting that as faster growth is arithmetic, not epidemiology.
The habit I have landed on, later than I should have, is to write the denominator out as a full sentence in plain English before running anything. Per 100,000 person years, among Australians aged 45 and over, resident in jurisdictions with complete public and private coverage across the whole period. If I cannot write that sentence, I do not have an analysis yet. I have a count.
None of this is difficult statistics. It is closer to reading comprehension. But it takes longer than the modelling, it never makes it into the abstract, and it is often the difference between describing a health system and misdescribing it.


Leave a comment